This is a graphical representation that allows you to track changes in results for a given analytical method.
Maintaining a control chart ensures that the analytical process is monitored, helps validate the analytical method by demonstrating its stability, and prevents the risk of failure by immediately detecting any potential drift.
A control chart can be created using several elements:
synthetic solutions prepared in the laboratory or purchased commercially,
actual samples (or internal reference material) for which the laboratory determines the parameter value using a reference method,
reference materials such as TITRIVIN.
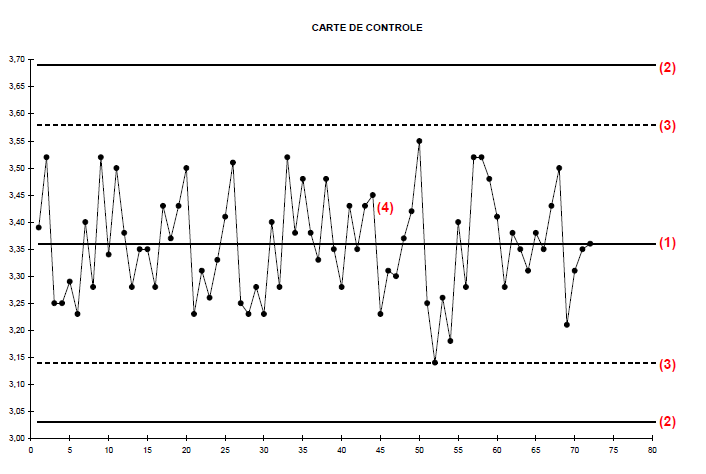
A control chart consists of:
(1): a center line corresponding to the target value m,
(2): two lines located at m ± 3 srepro, which correspond to the control limits,
(3): two lines located at m ± 2 srepro, which correspond to the monitoring limits,
(4): the curve of the individual results obtained at the control points.
srepro is the internal reproducibility standard deviation; it is defined by each laboratory.
Depending on the case, the target value m of the control chart will be:
the theoretical concentration of the synthetic solution,
the value assigned by the laboratory to the actual sample,
a value within the confidence interval of the reference value for a TITRIVIN.